BIKE CRASH STATISTICS
2023

UNDERSTANDING & ADDRESSING
BIKE SAFETY

No matter how you slice it, the greatest threat remains car drivers. Traffic fatalities are up across the board and bicyclists bear the brunt of the burden. Together these vulnerable two-wheeled riders accounted for 2% of all traffic fatalities in 2020. Estimates show that more cyclists perished in traffic accidents from 2016 to 2019 than in any three-year period in the last two decades.

2020 proved to be the year with the highest fatalities recorded for bike crashes in the last two decades. The high rate of these fatalities is assumed to be linked with the pandemic and the outcome that followed. 

Magnitude of the Problem

Bike Injuries on U.S. Roads Are Decreasing, but
Bike Deaths Are Increasing

These are the deadliest states for cyclists

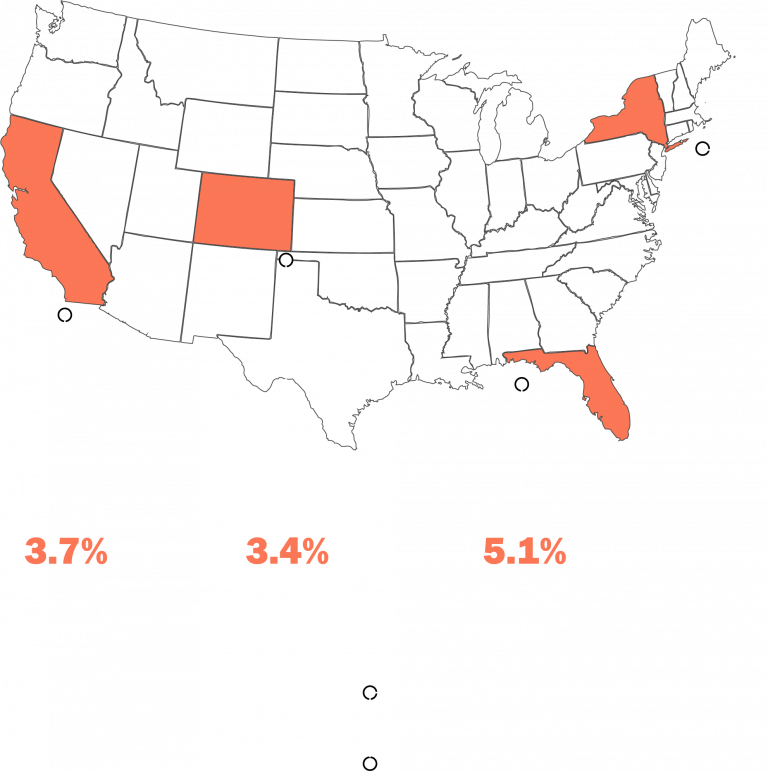
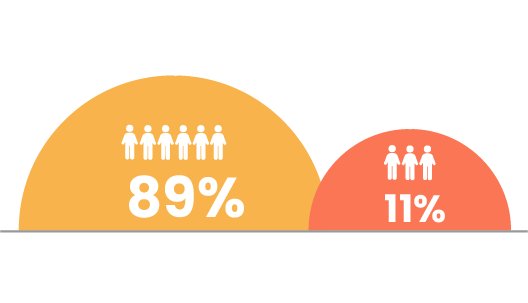
Unfortunately, bike deaths are occurring all over the country. Of these deaths, the bulk happens in California, Florida, Colorado and New York. According to NHTSA data from 2020, these states have the highest number of bicycle deaths in recent years. It is also important to note that 62% of bikers who were killed on the road were not wearing helmets. 

And, while this report focuses on fatalities, it notes that 425.910 bicyclists were injured in 2020.

The map below shows the percentage of total bike fatalities by state in 2019.

New York has the second most bike deaths in the United States. In 2019, 46 cyclists were hit and killed by drivers on the streets of New York, up from 29 deaths in 2018. Of these deaths, 97% of cyclists killed in New York were not wearing helmets. Despite implementing a Vision Zero safety program in 2014, which created 100 miles of protected bike lanes and decreased the citywide speed limit to 25 mph, New York is currently at its worst years for cyclists since 1999.

Accident or Crime?

Alcohol involvement was reported in 34% of the traffic crashed that resulted in cyclists’ deaths in 2019. Speeding drivers are also a major cause of bike deaths in the U.S making up 36% of all bike fatalities.

Other causes include drivers using smartphones, interacting with passengers, looking at something outside etc. All forms of distraction included 58% of bike fatalities.

36%

involved an aggressive driver

58%

involved a distracted driver

34%

involved a drunk rider

A Closer Look at Age and Gender

Male bikers are about four times more likely to be injured
and six times more likely to be killed on the road.

Bike Crashes by age group

In 2020,938 people in total died from bike crashes. Out of those numbers, 798 were males (89%) and 116 were females (11%). When we segment this data by age group, we find that bicyclists 55-74 years of age followed closely by bicyclists 35-54 years of age and 15-34 age bracket died in traffic crashes. From these numbers we can deduce that 47 is the average age of bike deaths.

While bike fatalities among children under the age of 14 have gradually decreased over the previous three decades, deaths among those aged 16 and over have progressively increased.

Where & When Are
Bike Crashes Occurring?

Bike riders are more likely to be hit in cities than in rural areas, with the former making up 78% of all cyclist deaths in 2019.

Indeed, the fact that the majority of bike fatalities occur in metropolitan location coincides with a higher number of both bicyclists and vehicles in those settings.

78%

of bike fatalities occur in urban areas

22%

of bike fatalities occur in rural areas

32%

of bike fatalities happen at intersections

68%

of bike fatalities happen at locations that are not intersections

49%

of bike fatalities occur in the daylight and 47% in dark

30%

of bike fatalities occur during the summer months

Time of day and day of week

The time of day cyclists ride is an important factor in finding out how much risk they face. Understanding the reasons for the numerous differences might help in making the roads safer for bike riders. In 2020, the majority of bike fatalities, about 314 (30%) occurred during summer months, specifically from June to August.

As we can see, rush hour is the deadliest time to be on the road, but dusk and sundown may also be deadly for two-wheeled riders.

How Do Bikers Get Hit?

Point of Impact and Vehicle type

Bike riders are more likely to be hit in cities than in rural areas, with the former making up 78% of all cyclist deaths in 2019.

Indeed, the fact that the majority of bike fatalities occur in metropolitan location coincides with a higher number of both bicyclists and vehicles in those settings.

Passenger Car

Bike riders who died in accidents with passenger cars were most commonly hit by the the front of the vehicle

Front

In 89.9% of cases, bicyclists were hit by the front of the passenger car.

Light Trucks

Light trucks were the most commonly involved vehicles in traffic accidents that resulted in the death of the bicyclists.

Right Side

In 4.3% of cases, bicyclists came in contact with the front of the SUVs

Large Trucks

Large trucks had the largest percentage of rightside collisions, leading to 20.5 and 19.3% of biker’s deaths, respectively.

Left Side

In 19.3% of cases, bicyclists were hit by the left side of the large truck.

Why Are These Statistics Important?

Despite this sobering facts, we remain hopeful that safer streets for bicycles are within reach. Leaders all throughout the country and the world are supporting laws and increasing infrastructure projects to make roadways safer for those who aren’t driving.

While it is impossible for bike riders to avert deadly crashes on their own, safe practices, adequate lane control and equipment, and most importantly awareness of roadway conditions and context are key to reduce risks. Investing in infrastructure, education and other transportation operations can also have a significant influence on traffic safety.