Transport is probably one of the most challenging sectors to decarbonize, particularly due to its high reliance on fossil fuel use and carbon-intensive infrastructure, as well as the way it imposes lifestyles that require people to go everywhere in large cars.
One easy way we can all contribute to combating climate change and minimize overall carbon footprint is to stop burning gasoline in order to get around and swap cars for e-bikes. These new transportation modes are bringing alternative ways to navigate short distances, and with 55% of all trips being under five miles in the U.S, the opportunity for disruption is huge.
The aim of this report is to quantify and better understand the potential of increasing e-bike uptake in the U.S and the advantages that may accrue as a result. Our research arm has used a small portion of the data to demonstrate a very straightforward way U.S states and cities can drastically reduce congestion and deliver environmental and economic benefits.
KEY FINDINGS
Cars, Americans’ most preferred mode of transport and unfortunately the most environmentally unfriendly one, are the largest source of CO2 emissions in the U.S. These vehicles run primarily on gasoline and account for 40.5% of transportation emission in 2020. Medium and light trucks account for 25.5% and 17.2% respectively, while other transportation modes such as aircraft, rail, ships and boats make up 14.8%.
A healthy planet is critical to human health and happiness, and dramatically reducing our reliance on fossil fuels is one of the most important actions that we can take in order to achieve this goal. In order to lead us away from toxic emissions and toward a sustainable future, we need a fundamental change not only in the way we consume but also in the way we get around. But here comes the good news: 55% of Trips in the U.S Are Less Than 5 Miles
This means that if you’re like most Americans, you likely drive fairly short distances, as 55% of car trips are five miles or less, — small distances that, in any reasonable world, would be considerably more readily traveled by active transportation modes such as bikes and e-bikes.
Of course, we are not underestimating the challenges that come with replacing even a small percentage of these car trips with e-bikes. Americans always have had the propensity to avoid riding their bikes for transportation. However, e-bikes have made it much easier to get around and not find yourself breaking a sweat or huffing it after just a few blocks.
Avoiding a short car trip to work, the playground, and the supermarket may not appear to be a decision with such an impact on your climate-conscious day-planner, but all of those miles add up. In fact, short trips are shown to be more polluting per mile than longer trips because even if their emissions levels across the board ultimately decrease, their deadly pollution spikes in the first few minutes of driving, according to Colorado Department of Transportation.
To this end, e-bikes have the potential to replace short-distance car rides, helping minimize Co2 emissions and changing urban mobility habits. The question becomes how to unlock this potential? Below we will explore how much change is possible, where and how e-bikes can be part of the solution.
Our country’s 276 million registered vehicles make U.S consumers heavily dependent on their cars as their primary means of transportation, generating 551,940 metric tons of CO2 daily, at a 5-mile range!
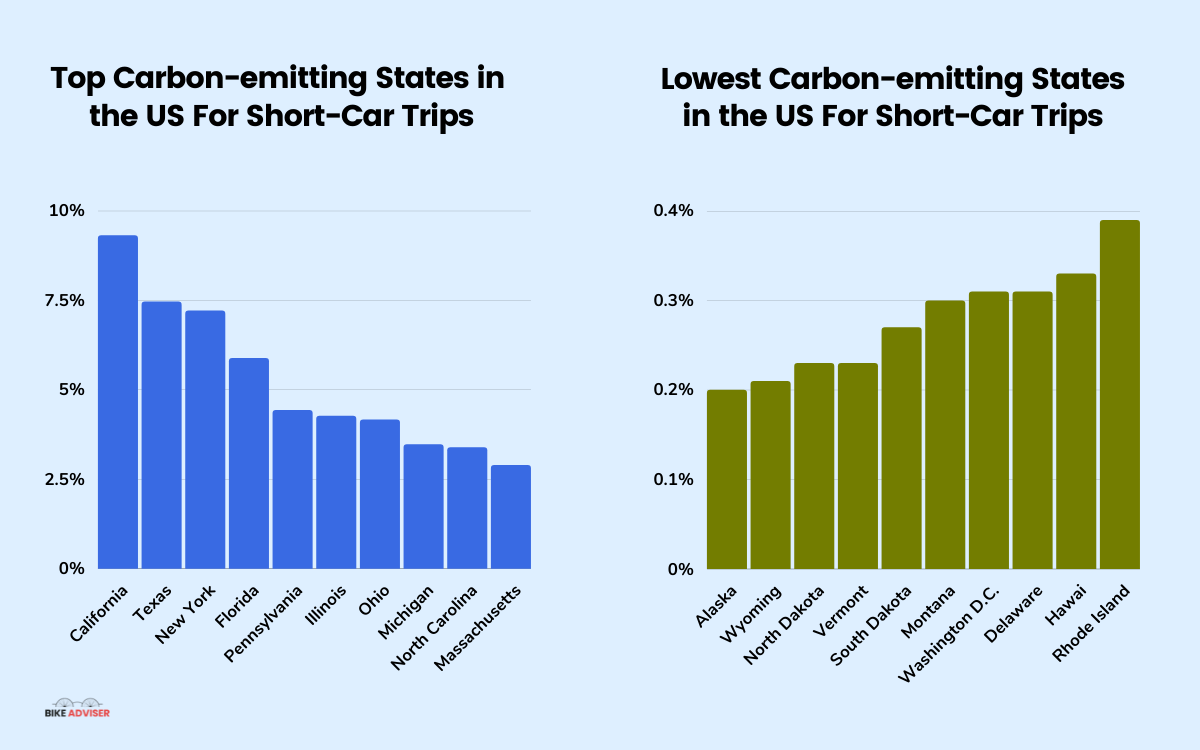
States in the U.S contribute varying amounts of CO2 depending on factors such as population, economic structure and government policies. Here are the states with the most carbon dioxide emissions rates for car trips up to 5 miles:
States like California, Texas, New York, Florida, Pennsylvania, Illinois, Ohio, Michigan, North Carolina, and Massachusetts are states that produce the most CO2 for short trips in the U.S and they are responsible for over half of the country’s total carbon emissions, which is nearly equal to the combined emissions of Croatia, Denmark and Portugal or all of Belgium’s emissions.
Large states like Texas and California tend to have the highest emissions on an absolute basis, producing more CO2 than Ohio, Michigan, North Carolina, and Massachusetts together.
There are some crucial indicators that accurately predict which states have the largest CO2 footprints and we can look at this in two parts. To begin with, states with the most significant CO2 emissions are states located in the east (Illinois, Ohio, Florida, Pennsylvania, New York, North Carolina) while all of the lowest carbon-emitting states are in the north (Montana, North Dakota, South Dakota, Idaho, Wyoming).
On the other hand, the states with the largest share of transportation emissions are also generally locations where people drive a lot. They have become increasingly urbanized and suburbanized, making trips around large metro areas result in more CO2 emissions.
E-bike carbon reduction capability is the maximum cumulative carbon dioxide emission reduction potential that could be achieved if people replaced as many of their short car trips with an e-bike as possible. Nationally, this could be more than 200 million metric tons per year, which would save 98% of current CO2 emitted from cars at 5 miles.
At 5 miles, an e-bike is responsible for 15.55g of CO2 while a car emits a whopping 2020g! This means that by cutting a file mile trip out of your schedule each weekday, the modal shift would see a 540K daily reduction in CO2 emissions- the equivalent amount of CO2 released by 240 return flights from London to New York.
Obviously, this is a rather quantitative and idealistic approach. There are significant barriers to replacing even a small percentage of car trips on our roads with e-bike trips. Therefore, we decided to take a more realistic and conservative approach, using only 8% and 50% adoption rates.
At a national level, if Americans replaced 50% of their short-distance car trips with e-bikes, we would save a whopping 273K metric tons of CO2 every day. If you have a hard time putting these numbers in context, this is equivalent to carbon sequestered by 4.5 million tree seedlings grown for 10 years. Even with a substitute effect of only 8%, e-bikes would replace enough car trips to represent a substantial share of CO2 saved.

Below we will see in which states e-bikes can have the highest potential for disruption and how much CO2 they can save based on these adoption rates.
Analyzing thousands of data points from CENSUS and US Environmental Protection Agency, we ranked the U.S states where e-bikes have the most potential to replace car trips with e-bikes. Then we used low (8%), and high (50%) replacement rates of short car trips to show how much CO2 each state would save per day if these adoption rates were to
| United States of America / States | Trips 1-5 Miles | CO2 MT Emitted | CO2 MT Reduced with 8% Adoption Rate | # of Smartphones Charged | # of Return Plane Flights NY - LDN | # of Trees To Sequester This CO2 for 10 Yrs. |
|---|---|---|---|---|---|---|
| Alaska | 51.5% | 1.1K | 88 | 10M | 96 | 1.4K |
| Alabama | 49.5% | 6.9K | 550 | 66M | 599 | 9K |
| Arkansas | 51% | 4.2K | 336 | 40M | 366 | 5.5K |
| Arizona | 50.8% | 9.7K | 774 | 94M | 844 | 12K |
| California | 55.2% | 51.3K | 4,078 | 49M | 4,442 | 67K |
| Colorado | 52.7% | 11K | 873 | 106M | 951 | 14K |
| Connecticut | 57.5% | 6.8K | 545 | 66M | 594 | 9K |
| Washington D.C | 64.7% | 1.7K | 137 | 16M | 150 | 2.2K |
| Delaware | 56% | 1.7K | 137 | 16M | 149 | 2.2K |
| Florida | 57.2% | 32.4K | 2,575 | 313M | 2,805 | 42K |
| Georgia | 52.6% | 15.9K | 1,263 | 153M | 1,376 | 20K |
| Hawaii | 57.1% | 1.8K | 146 | 17M | 159 | 2.4K |
| Idaho | 53.8% | 5.8K | 463 | 56M | 504 | 7.6K |
| Illinois | 50.4% | 2.4K | 191 | 23M | 209 | 3.1K |
| Indiana | 57% | 23.5K | 1,869 | 227M | 2,037 | 30K |
| Iowa | 55.8% | 13.4K | 1,064 | 129M | 1,159 | 17K |
| Kansas | 57.2% | 5.6K | 450 | 54M | 490 | 7.4K |
| Kentucky | 52.2% | 8.3K | 665 | 80M | 724 | 10K |
| Louisiana | 53.5% | 7.8K | 621 | 75M | 676 | 10K |
| Maine | 58.6% | 15K | 1,266 | 153M | 1,379 | 20K |
| Maryland | 57% | 11K | 883 | 107M | 962 | 14K |
| Massachusetts | 50.8% | 2.7K | 216 | 26M | 235 | 3.5K |
| Michigan | 56.1% | 19.1K | 1,520 | 184M | 1,656 | 25K |
| Minnesota | 54% | 10.4K | 826 | 100M | 900 | 13K |
| Missouri | 53.3% | 10K | 796 | 96M | 868 | 13K |
| Mississippi | 48.8% | 4K | 320 | 38M | 348 | 5.2K |
| Montana | 52.6% | 1.6K | 130 | 15M | 142 | 2.1K |
| North Carolina | 54.4% | 18.6K | 1,484 | 180M | 1,617 | 24K |
| North Dakota | 54.6% | 1.2K | 103 | 12M | 112 | 1.6K |
| Nebraska | 55.7% | 3.5K | 285 | 34M | 310 | 4.7K |
| New Hampshire | 53.5% | 2.8K | 230 | 27M | 250 | 3.7K |
| New Jersey | 56.9% | 15.7K | 1,253 | 152M | 1,365 | 20K |
| New Mexico | 53.6% | 3.8K | 306 | 37M | 334 | 5K |
| Nevada | 53.7% | 4.7K | 377 | 45M | 411 | 6.2K |
| New York | 55.8% | 39.7K | 3,157 | 384M | 3,439 | 52K |
| Ohio | 57.4% | 22.9K | 1,822 | 221M | 1,984 | 30K |
| Oklahoma | 54% | 6.1K | 485 | 59M | 528 | 8K |
| Oregon | 53.7% | 6.7K | 539 | 65M | 587 | 8.9K |
| Pennsylvania | 56.7% | 24.4K | 1,939 | 235M | 2,112 | 32K |
| Rhode Island | 61% | 2.1K | 171 | 20M | 186 | 2.8K |
| South Carolina | 53.4% | 8.3K | 662 | 80M | 721 | 10K |
| South Dakota | 53.2% | 1.5K | 120 | 14M | 131 | 1.9K |
| Tennessee | 53.7% | 11.8K | 942 | 114M | 1,026 | 15K |
| Texas | 54.2% | 41.1K | 3,267 | 397M | 3,558 | 54K |
| Utah | 54.6% | 5.2K | 420 | 51M | 458 | 6.9K |
| Virginia | 55.5% | 15.7K | 1,248 | 151M | 1,359 | 20K |
| Vermont | 49.1% | 1.2K | 101 | 12M | 110 | 1.6K |
| Washington | 51.5% | 10.9K | 867 | 105M | 945 | 14K |
| Wisconsin | 55.6% | 11.7K | 936 | 113M | 1,019 | 15K |
| West Virginia | 48.8% | 2.8K | 227 | 27M | 248 | 3.7K |
| Wyoming | 57.3% | 1.1K | 91 | 11M | 99 | 1.5K |
| United States of America / States | Trips 1-5 Miles | CO2 MT Emitted | CO2 MT Reduced with 50% Adoption Rate | # of Smartphones Charged | # of Return Plane Flights NY - LDN | # of Trees To Sequester This CO2 for 10 Yrs. |
|---|---|---|---|---|---|---|
| Alaska | 51.5% | 1.1K | 549 | 66M | 598 | 9K |
| Alabama | 49.5% | 6.9K | 3,439 | 418M | 3,746 | 56K |
| Arkansas | 51.0% | 4.2K | 2,100 | 255M | 2,288 | 34K |
| Arizona | 50.8% | 9.7K | 4,840 | 588M | 5,272 | 80K |
| California | 55.2% | 51K | 25,488 | 3B | 27,764 | 421K |
| Colorado | 52.7% | 11K | 5,457 | 663M | 5,944 | 90K |
| Connecticut | 57.5% | 6.8K | 3,409 | 414M | 3,713 | 56K |
| Washington D.C | 64.7% | 1.7K | 860 | 104M | 937 | 14K |
| Delaware | 56% | 1.7K | 855 | 104M | 931 | 14K |
| Florida | 57.2% | 32.4K | 16,094 | 1.9B | 17,531 | 266K |
| Georgia | 52.6% | 15.9K | 7,893 | 960M | 8,598 | 130K |
| Hawaii | 57.1% | 1.8K | 912 | 110M | 994 | 15K |
| Idaho | 53.8% | 5.8K | 2,894 | 352M | 3,153 | 47K |
| Illinois | 50.4% | 2.4K | 1,199 | 145M | 1,306 | 19K |
| Indiana | 57% | 23.5K | 11,686 | 1.4B | 12,729 | 193K |
| Iowa | 55.8% | 13.4K | 6,649 | 808M | 7,243 | 109K |
| Kansas | 57.2% | 5.6K | 2,810 | 341M | 3,061 | 46K |
| Kentucky | 52.2% | 8.3K | 4,154 | 505M | 4,525 | 68K |
| Louisiana | 53.5% | 7.8K | 3,881 | 472M | 4,228 | 64K |
| Maine | 58.6% | 15.9K | 7,910 | 962M | 8,616 | 130K |
| Maryland | 57% | 11K | 5,521 | 671M | 6,014 | 91K |
| Massachusetts | 50.8% | 2.7K | 1,350 | 164M | 1,471 | 22K |
| Michigan | 56.1% | 19.1K | 9,500 | 1B | 10,348 | 157K |
| Minnesota | 54% | 10.4K | 5,162 | 627M | 5,623 | 85K |
| Missouri | 53.3% | 10K | 4,978 | 605M | 5,422 | 82K |
| Mississippi | 48.8% | 4K | 1,998 | 243M | 2,177 | 33K |
| Montana | 52.6% | 1.6K | 813 | 98M | 885 | 13K |
| North Carolina | 54.4% | 18.6K | 9,277 | 1B | 10,105 | 153K |
| North Dakota | 54.6% | 1.2K | 641 | 78M | 699 | 10K |
| Nebraska | 55.7% | 3.5K | 1,781 | 216M | 1,940 | 29K |
| New Hampshire | 53.5% | 2.8K | 1,435 | 174M | 1,563 | 23K |
| New Jersey | 56.9% | 15.7K | 7,829 | 952M | 8,528 | 129K |
| New Mexico | 53.6% | 3.8K | 1,914 | 232M | 2,085 | 31K |
| Nevada | 53.7% | 4.7K | 2,358 | 286M | 2,568 | 38K |
| New York | 55.8% | 39.7K | 19,733 | 2.4B | 21,495 | 326K |
| Ohio | 57.4% | 22.9K | 11,385 | 1.3B | 12,402 | 188K |
| Oklahoma | 54.0% | 6.1K | 3,032 | 368M | 3,302 | 50K |
| Oregon | 53.7% | 6.7K | 3,368 | 409M | 3,669 | 55K |
| Pennsylvania | 56.7% | 24.4K | 12,119 | 1.4B | 13,202 | 200K |
| Rhode Island | 61.0% | 2.1K | 1,067 | 129M | 1,162 | 17K |
| South Carolina | 53.4% | 8.3K | 4,137 | 503M | 4,506 | 68K |
| South Dakota | 53.2% | 1.5K | 752 | 91M | 819 | 12K |
| Tennessee | 53.7% | 11.8K | 5,885 | 715M | 6,411 | 97K |
| Texas | 54.2% | 41K | 20,417 | 2.4B | 22,240 | 337K |
| Utah | 54.6% | 5.2K | 2,627 | 319M | 2,862 | 43K |
| Virginia | 55.5% | 15.7K | 7,799 | 948M | 8,495 | 128K |
| Vermont | 49.1% | 1.2K | 631 | 76M | 688 | 10K |
| Washington | 51.5% | 10.9K | 5,420 | 659M | 5,904 | 89K |
| Wisconsin | 55.6% | 11.7K | 5,849 | 711M | 6,371 | 96K |
| West Virginia | 48.8% | 2.8K | 1,421 | 172M | 1,547 | 23K |
| Wyoming | 57.3% | 1.1K | 569 | 69M | 620 | 9.4K |
E-bikes could thrive in a state like D.C where people are urged to ditch their cars and take up cycling due to looming congestion pricing tolls and an increase of protected bike lanes. Not only that but, the high proportion of short-distance trips in the D.C (64% of trips are less than 5 miles) highlights the state’s high profile for e-bikes to harvest their use to the fullest potential.
Based on our calculations, we have estimated that switching only 8% percent of these short trips with e-bikes would save DC 137 metric tons of CO2 daily, the equivalent amount of CO2 released by 150 return flights from London to New York.
Rhode Island, Massachusetts, Connecticut, and Ohio comprise the other top 4 U.S states that could benefit the most from e-biking due to their relatively short-distance trips that could be switched from cars to e-bikes. Part of this can be explained by these states’ high population density and relatively small geographic size. Additionally, these states are known for engaging in urban planning on the neighborhood level, allowing them to smoothly switch to e-bikes and save the planet along the way.
Switching from cars to e-bikes, these states together would save our country 2,753 metric tons of CO2 every day at an 8% adoption rate. This is equivalent to CO2 emissions from 334 million smartphones charged.
Among the top 5 states for e-bike potential, Massachusetts is the perfect example of a place where short car trips can be replaced with e-bikes. Mos of the cities in Massachusetts are known as waking towns and have easy access to public transit. With 50.81% of trips less than 5 miles, Massachusetts is one of the easiest states to get around on two-wheels and ride with minimal exposure to traffic.
bay staters would see a daily
reduction, equivalent to 235 return flights from London to New York.
It’s no surprise that large and heavily populated states rank lower in the list, but they’re also the country’s hotbed for CO2 emissions. Targeting the big polluters will help generate greater CO2 savings, and alleviate how buying wood affects environments. While California (ranked 21st), Texas (25th ), New York (ranked 16th) have lesser 0–5-mile trips (55%,54% and 55% respectively) than DC or Rhode Island (both over 61%), they are states famous for their love affair with cars and products of high CO2 emissions.
For instance, California leads all fifty U.S states in CO2 emissions from transport. In fact, at 51,370 metric tons of CO2 emitted by cars every day in California, D.C doesn’t even come close. If only 8% of car trips in California were to be replaced with e-bikes, our country would save 4,078 metric tons of CO2 every day, enough to power 496 million smartphones. This is almost equal to the combined CO2 emissions saved in D.C, Rhode Island, Connecticut, Wyoming and Ohio together.
Mississippi (48%), West Virgina (48%), Vermont (49%), Alabama (49%) rank at the bottom of the list due to their lower distribution of short duration trips compared to denser states such as D.C or Florida. However, this does not mean these states are not primed for e-bikes to replace short car trips; they all have over 45% of trips consisting less than 5 miles, making them appealing and a great opportunity for 5-mile car trips displacement and CO2 reduction.
In fact, no matter where you live in the U.S switching from cars to e-bikes will greatly reduce carbon emissions and positively impact the planet. So just because you are not living in D.C doesn’t mean you will get a bad deal on e-bike potential. You can still substitute short car trips and do something good for the environment, by using sustainable transport options regardless of which state you call home.
Now that we know the importance of e-bikes, we asked an expert to provide some advice and predictions on micromobility in the U.S. Read his thoughts below
The Sustainable Transportation Program Manager at TREC (Portland State University).

What are your thoughts about the state of micromobility in the United States today?
Before COVID, micromobility was expanding, especially with the increase of e-scooters in cities and the growth of e-bike share. I think we will continue to see this trend into the future as cities are encourage micromobility options. The same goes with personally owned bikes or other micromobility devices. Cities are investing in infrastructure expansion which is a key implementation driver for micromobility. Finally, the large legacy brands have fully embraced the e-bike market which will provide a broader range of bikes at different price points. With the growing interest in incentive and outreach programs at the city and state levels, we should see a strong continued growth.
How can cities change their street designs to accommodate the technology?
As stated above, cities are investing in expanding bike and multipurpose path infrastructure. Cities like Seattle, Chicago, Portland, DC, and New York are actively expanding their networks. There is interest in rethinking street design to add micromobility lanes which would provide wider spaces in the roadway for micromobility vehicles. We shall see how cities approach this concept and the public discourse on repurposing travel lanes for transit and micromobility only vehicles.
How do you see the technology developing? Will people buy more E-bikes in the near future? How will cities handle micromobility devices in the coming years?
The technology is developing very fast and there is a growth of opportunity in the space to include micromobility devices in the connected vehicle environment. E-bikes sales will continue to be a strong market, as long as product supplies can meet demand. Cities will be challenged in the future to manage the shared mobility market and the opportunities it can provide for people. Part of this will be the potential number micromobility trips but also the use of shared spaces. Lastly, cities need to focus on inclusive and equitable shared mobility to provide underserved communities with enhanced and affordable mobility options.
We must change our minds in the face of the climate crisis. Policymakers must look beyond what they believe people want and instead prepare for a transportation system that minimizes CO2 emissions while also delivering efficient, accessible mobility for everyone. E-bikes have the potential to help get cars off the road while also lowering emissions, pollution, and gas consumption.
When more than half of all trips in the U.S are less than 5 miles (a short e-bike ride), you’ll be surprised how simple it is to hop off your car and onto two wheels while having fun, riding with friends and protecting the environment along the way.
mETHODOLOGY
MEDIA CONTACTS
Fatbardhë Maloku
Sr. Digital PR Specialist
Dardan Shehu
Sr. Content Marketing Specialist
Brayden Lucas
Outreach Specialist
TheBikeAdviser.com